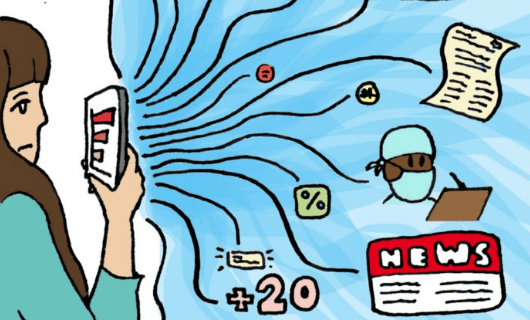
Featured Image courtesy of Alexandra Alberda (2020)
Data can be daunting. The representation of information as convoluted webs of numbers and graphs is oftentimes bewildering and off putting. In a time where data is becoming increasingly important in the lives of a sprawling range of demographics (Tapper 2020), the need for coherent, reliable representations of statistics and facts grows more and more prevalent. This need could potentially be sated by data comics and graphic medicine, an emerging field for simplifying data championed by PhD researcher Alexandra Alberda. Alberda provided an online talk about the topic at Bournemouth University in October of 2020, right at the peak of the COVID-19 pandemic.
The concepts of graphic medicine and data comics here are defined as the grappling of medical data, statistics and qualitative findings, and the representation of this data visually or narratively by way of comics, illustrations or infographics (Williams 2012). The intended outcome of such visual representations is to provide for a given audience a means to interpret healthcare data in a manner more entertaining and engaging than some academic examples, such as a PowerPoint presentation or journal article (Zhao 2015). As a result, data comics and graphic medicine promise to induct non-specialised groups into the realm of potentially difficult medical data and provide useful information regarding this topic.
Throughout the course of her talk, Alberda highlighted some of the benefits of employing graphic medicine to convey complex statistics and concepts regarding health to a generalised audience. These benefits range from the engaging nature of data presented graphically or humorously to the use of graphic pathographies to communicate the individual healthcare journeys of patients and workers. These informative, personalised memoirs help both to preserve the facts of a given healthcare crisis and provide meaningful representation regarding complex personhood (Alberda 2020). As such, graphic medicine is demonstrated here not only as a means to communicate difficult health statistics, but as a humanised narrative tool to address the mental impacts of related healthcare situations (Farthing et al. 2016).
Alberda proceeded to discuss the potential power data comics and graphic medicine could wield in regards to the encouraging of meaningful change. If this kind of visual data can help non-specialist audiences feel included in the conversation regarding healthcare, and inspire empathy within them, then there is potential for graphic medicine to incite a widespread behavioural shift. Evidence of the comic medium bearing this kind of impact can be found in Yeung et al.’s (2014) study, which ascertained that a manga comic promoting healthy eating had influenced a number of New York children to reconsider their snacking habits. Harnessed properly, the illustration of important health messaging can lead to revised attitudes and behaviours regarding relevant issues.
Each of these points, of course, have potential application concerning the current COVID-19 pandemic. Heartfelt graphic pathographies about life in lockdown could help cultivate a sense of connectedness in these decidedly disconnected times. Emotive, informational comics could inspire bolstered respect for social distancing conventions. The implications of this method of communicating data are as broad as they are promising.
Reference List
Alberda, A., 2020. Graphic Medicine. In: Feigenbaum, A., Alamalhodaei, A., The Data Storytelling Workbook. England: Routledge, 163-166
Farthing, A., Priego, E., 2016. Data from ‘Graphic Medicine’ as a Mental Health Information Resource: Insights from Comics Producers. Open Health Data [online], 4 (1)
Leung, M., Tripicchio, G., Agaranov, A., Hou, N., 2014. Manga Comic Influences Snack Selection in Black and Hispanic New York City Youth. Research Brief [online], 46 (2), 142-147
Tapper, J., 2020. Go figure: how Britain became a nation of armchair statisticians. The Guardian [online], 8 Nov 2020. Available from: https://www.theguardian.com/world/2020/nov/08/go-figure-how-britain-became-a-nation-of-armchair-statisticians [Accessed 3 Feb 2021]
Williams, I.C.M., 2012. Graphic medicine: comics as medical narrative. Medical Humanities [online], 38, 21-27
Zhao, Z., Marr, R., Elmqvist, N., 2015. Data Comics: Sequential Art for Data Driven Storytelling [online]. Maryland: University of Maryland
