
On Thursday, we had the pleasure of inviting PhD researcher Alexandra Alberda to discuss the fascinating world of Graphic Medicine and the power of comic writing in representing data. An interactive, highly visual presentation offered insight on the importance of cultural consideration and emotional resonance when visualising and communicating data to an audience, widespread or specific. If we can develop a method of representing data that captures the idea of complex personhood and evades sanitation, capabilities Alexandra suggests are characteristic of Graphic Medicine, then the process of communicating complicated ideas to a general audience becomes much simpler.
This is particularly relevant in the troubling times of COVID-19, where a culture of unease and misinformation calls for sources of information that are “approachable, accessible and relatable”. Alexandra believes in harnessing these menacing, often mystifying points of data and translating them into a graphic format that is easy to digest and identify with.
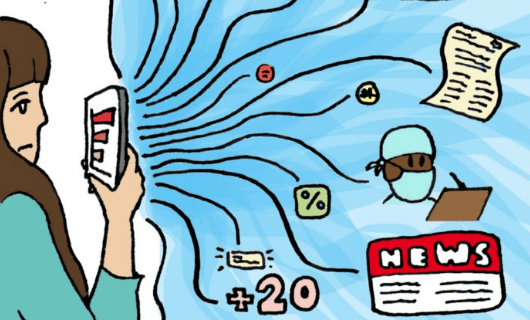
“Data comics aim to bridge scary data to something more concrete and relatable.”
-Alexandra Alberda, during her presentation
This discipline of Graphic Medicine, while still developing and growing in the wake of a new and unknown pandemic, is proven through the work of multiple artists to be an educational, emotive, and oftentimes humorous means of communicating data. Ken Dahl’s ‘Monsters’, featured below, is just one example of this. Alexandra celebrates the process of humanising statistics in this way, and the promising implications it suggests for the health sector and in general.

Examples of Alexandra’s research illustration accompany rich and intriguing philosophies in ‘The Data Storytelling Workbook’, Anna Feigenbaum and Aria Alamalhodaei’s quintessential reading on the methods and impact of visualising data.
This coming Thursday, our speaker series continues with Anastasia Kavada’s presentation on mutual aid groups and digital media during the times of COVID-19. Be sure to drop by or contact Dr. Anna Feigenbaum for more details.